15 Most Important Google Analytics Metrics You Must Monitor
What stops you from growing your website in the way that best suits your brand? It’s the lack of knowledge about different metrics and key performance indicators that drive your website. When you have a website that represents your brand, it is expected to attract potential customers and convert them to loyal customers. There are so many ways a website can endeavor and improve its conversion rate. However, prior to that, it is very important to understand those specific metrics on the basis of which you would try to improve your website performance.

Google Analytics uses two elements to monitor the website performance on different aspects- Dimensions and Metrics. Metrics in simple words, define ‘what exactly happened on your website’ while the Dimensions let you know ‘how it happened’.
In this article, we are focusing on 15 most important Google Analytics metrics which you should always monitor. Monitoring these metrics can certainly provide you a deep insight and unveil new ways to optimize your strategies. So, let’s hop into it and find out which metrics you should monitor.
General Metrics
1. Conversion Rate: Google Analytics provide a precise tracking of conversion rates on your website. This metrics defines the ratio of visitors that are taking the desired actions expected from them in your favor. For example, how many visitors are clicking on the ‘Buy Now’ CTA on a landing page is a data that you can track.
2. Goal Conversions: This ratio defines how many visitors reached to a certain goal that you have set in the Google Analytics for all conversions.
For example, The CTA button in above case was finally meant for triggering a sale on the site. So the goal conversion was making a sale. Now, if customers are clicking on the ‘Buy Now’ button, that would be the conversion rate of the CTA button. However, if the customers are not completing the checkout even after clicking on the ‘Buy Now’ button, the goal conversion would not be attained.
3. User Defined: Google Analytics allows the website owners to add an additional label to visitors who reach a certain goal or complete a specific action on the site, such as a visit to a specific webpage, or purchase of a specific product. These labels are generally called as Custom Segments, and they are defined by the GA user to obtain a deeper insight into visitors by targeting specific tasks and actions.
4. Exit page reporting (Abandoned carts): Bounce rates on your website are not all derived from the home page. Often times a brand shows its final call-to-action on the second or third page of a process. In order to maximize the chances of your conversions, you should investigate further into the exit points and find out at which point, in the process, the visitors are leaving the website or abandoning their shopping cart.
The Exit page Reporting in GA gives you a breakdown of the number of Exits, page views and the percentage of Exits. You can find the report under “Content > Site Content > Exit Pages”
Visibility Metrics
5. Bounce Rate and Time on Site: These 2 GA metrics are interconnected with each other. They help you find out if a visitor was able to find what he was looking for on the site, or just left the site immediately because he could not find it. Understanding these GA metrics will help you focus on the users’ requirement and evaluate the sources of traffic.
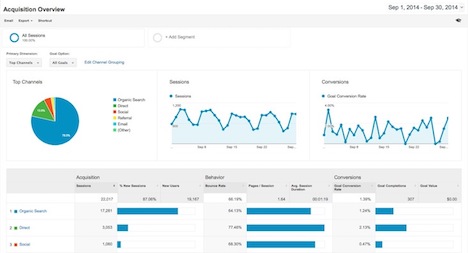
6. Traffic sources: It’s a data-rich report from GA generated by traffic segmentation based on specific sources and Mediums. The Google Analytics Traffic Sources categorizes your website traffic as direct traffic, referring traffic, or search engine traffic.
Direct traffic is from those visitors who land directly on your site by typing your URL in the browser’s address bar, through a bookmark, or by clicking on a link in an email, SMS, or chat.
Referrer traffic or referral traffic, are those visitors who click a link on some other site and land on your site.
Search engine traffic comes from visitors clicking on search results from your website on any of the search engines’ SERPs. This traffic can be organic as well as Paid in the form of Ads on SERPs.
7. Non-Branded Keywords: Non branded traffic comes through the search engines and they are focused on keywords that do not include your brand name or company name. These reports let you understand how people can discover your website online through keywords not including your name at all. Monitoring this traffic can help you identify the strong keywords used in general context that correlate with your business without mentioning your brand name.
For example, ‘One-page checkout‘ is a non-branded keyword, but ‘Knowband-one page supercheckout’ is a branded keyword. Having a good traction with non branded keywords is a positive sign for your organic SEO.
8. New vs Returning Visitors: When a user returns to your website, there are two aspects you should be concerned about- why did this user return, and was he/she converted when visited for the first time—if not, what can you do now to convert this person on a return visit?
This metrics gives you the insights to visitor loyalty and show you if you are making new customers, or losing the old customers on your website. You can entice your visitors to return, or you can plan new strategies to attract new customers based on the needs as suggested by this metric. You can find this report under the Visitors section of Google Analytics.
Transaction Metrics
9. Cost Per Transaction: This metric is used to measure the cost involved in promotional activities to successfully convert a user using specific campaigns (AdWords, banners, newsletters etc). This is a calculation of value per visit, and one of the most important GA metrics.
Cost per transaction may also be referred to as “cost per conversion or “lead generation costs”. This metric helps you to understand that if you have a high cost per conversion, then despite your website is bringing in a large number of conversions, your net income will be zero or into the negative. When you are working to increase conversions on your website, you need to keep the cost per conversion/transaction low, so as to maintain the overall margin as positive. When this metric becomes high, take a pause and reevaluate where exactly the costs are hurting your margin.
10. Average Order Value: Average Order Value (AOV), or Average transaction Value, or Average Value is the average value of an eCommerce transaction. It is calculated as
Average Value= Total Revenue/Total transactions
This metric can be found in the E-Commerce section of the Google Analytics. Monitoring this metric would help you analyze the efficiency of your cross selling and up selling techniques, such as performance of coupons and vouchers and their implications on the average income per order.
11. Average products per transaction: This metric shows how many products on an average are there in the basket per transaction. By monitoring this metric you will be able to unveil, which product is being sold more and generally how many products are being sold altogether. It is the equivalent of total products sold / Total transactions. Depending on the business nature, average basket size can be a very important metric
12. Conversion rate Per Medium: This specific metric shows the rate of conversion for each medium used to acquire the traffic. It defines the conversion rate for each medium, thus allowing you to identify the top selling channels for your website. This metric is extremely useful when your website traffic comes from a number of sources and you want to know which source sends the traffic that gets converted. The reports for this metric can be found under “All Traffic Sources” menu using the “Medium” view.
Geo Targeting Metrics
13. Transaction distribution per Country: When it comes to location-based targeting, Google Analytics provide the best options to track your customers based on country/territory. This metric reports some useful insight by distinguishing your customers on the basis of their nationality (GEO Location). The report can be seen under the Visitors section in Map overlay report.
14. Bounce rate distribution per Country: You can monitor this metric from the same Visitors section as in the above point. This is a useful metric to follow as you will have a clear idea of bounce rate distribution per country/territory. It will help you to plan your optimizations specific to a country/territory if you are targeting a particular location.
15. Traffic distribution on Country/Territory basis: As the heading suggest, GA provides the detailed information for your website’s traffic distribution. Through Traffic source monitoring, it can show you the traffic distribution per country/territory basis. Knowing this will help you plan your strategies accordingly for the particular locations. You can easily find this report in the map overlay report under the Visitors menu of GA.
Closing words
Google Analytics has so much in its trunk that sometimes businesses fail to utilize all of them. It’s understandable, because, it’s a complex data and requires a sharp observation to interpret. To make this easy, there are simpler solutions available in the market that provides the GA reports in a much simpler way understandable by everyone. For example, a similar solution available as Magento Google Analytic Enhanced Ecommerce provides the Magento store owners GA statistics right on their Magento administration console so that they can quickly view Analytics data inside their site’s admin panel itself.
So, which Metric do you monitor on your website using Google Analytics? Let’s know if you follow any other metric in the comments below.

You May Also Like:
 20 Metrics to Measure How Successful is Your Landing Page
 Top Tips to Use Google Analytics for SEO Purposes
 25 Ranking Signals Google Use to Rank Websites in Search Results
 Top 25 Best Free Real-Time Website Analytics Tools (2024)
 SEO Tips: See Google Panda or Farmer as a Point Scoring System
 4 Ways to Check If Google Has Penalized / Banned Your Website
 5 Basic SEO Tips to Rank Higher on Google Search Results
 10 Tips: How to Better Use Google Webmaster Tools