26 Free Infographics Tools and Data Visualization Softwares
Which is the best free online tool to create your own infographics? Instead of reading a 1500-word long article, many readers will prefer visually appealing infographic. Why? Well there’s a saying goes like “a picture is worth a thousand words”, an infographic with images, graphs and charts is able to convey complex data and information that is much easier to understand. That’s the reason why the graphic visual representations are getting popular on the web and are regularly showcased on websites and blogs that talk about design, technology and social media.
While we know that it’s not easy to create infographics from scratch, many people don’t even know how and where to get it started. If you are interested to create your first infographics, here are 26 really useful online tools you can try out!
Do you have any inforgaphics created by using one of the tools listed below? Share with us in the comments box below!
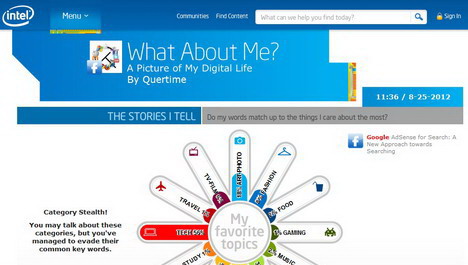
1. What About Me?
What About Me is a cool tool offered by Intel that lets you create infographic of your digital life on Facebook, Twitter and YouTube. All you have to do is log in your social media account through its page and your inforgraphic will be generated in seconds.
2. Visual.ly
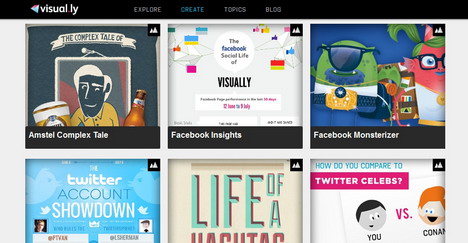
Visual.ly is a large community platform for infographics and data visualization. To create your own infographics, you can browse their gallery and choose an infographic you want to customize. Next, login to your Twitter or Facebook account and authorize the Create app. Now you can select the accounts, hashtags, or pages that you want to explore.
3. Piktochart
Piktochart is another infographic and presentation tool that helps you make information more beautiful. It’s suitable for teachers and students to create engaging infographics which can be used as a supplement to teaching materials and assignments.

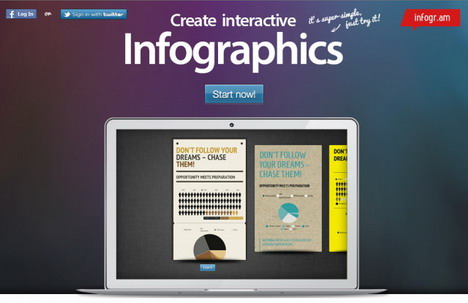
4. Infogr.am
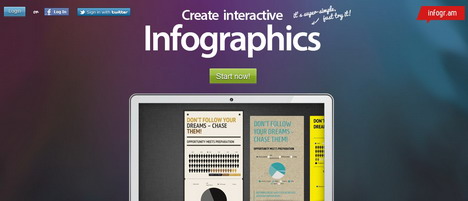
Infogr.am is a simple visual storytelling app that enables you to create beautiful infographics and interactive charts with ease. The web based visualization tool offers several templates for your customization. You are allowed to add chart and picture, embed video, and insert text.
5. Inkscape
An open source scalable vector graphics editor for creating and editing infographics. It supports many advanced SVG features (markers, clones, alpha blending, etc.) and it’s easy to edit nodes, perform complex path operations, trace bitmaps and much more.
6. Google Public Data Explorer
The Google tool makes large datasets easy to explore, visualize and communicate. You don’t have to be a data expert to navigate between different views, make your own comparisons, and share your findings.
7. Google Chart Tools
Google chart tools provide you rich gallery of interactive charts and data tools for generating an awesome infographics.
8. amCharts Visual Editor
You can use this visual editor as a web service for including charts, line & area, column & bar, pie & donut, scatter & bubble and more to your pages.
9. Chart.js
Chart.js is the perfect data visualization tool for hobbies and small projects. Using HTML 5 canvas elements to render charts, Chart.js creates responsive, flat designs, and is quickly becoming one of the most poplar open-source charting libraries.

10. Creately
Creately’s online diagramming tool lets you draw diagrams in minutes. You can draw any diagram type using their free templates and examples.
11. Easel.ly
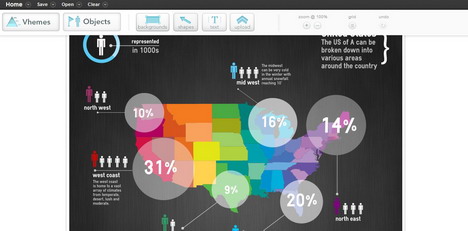
Easel.ly is another infographics generator that enables you to create and share visual ideas online. Just drag and drop a vheme onto your canvas for easy creation of your visual idea.
12. Vizualize.me
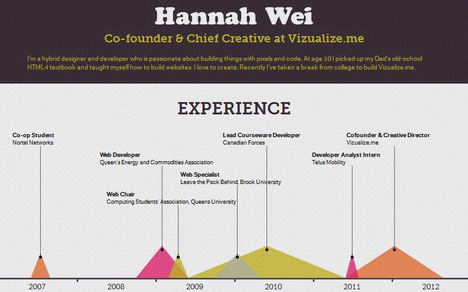
This online tool lets you create infographic for visualizing your resume. Before that you’ll have to create an account or you can sign up through LinkedIn account.
13. Timeline JS
TimelineJS lets you create timeline by pulling in media from different sources. It has built in support for Twitter, Flickr, Google Maps, YouTube, Vimeo,and more media types.
14. ChartsBin
Another free app for creating your own interactive map. Once the map is created, you can embed it in your own website, blog or export it as an image.
15. Datawrapper
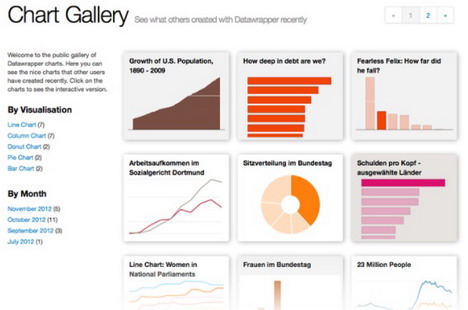
Datawrapper is an data-visualization tool for making interactive charts. Once you upload the data from CSV file or paste it directly into the field, Datawrapper will generate a bar, line or any other related visualization. Many reporters and news organizations use Datawrapper to embed live charts into their articles.
16. Many Eyes
Many Eyes is a data visualization tool from IBM. It enables users to upload data and then generate graphic representations with only three simple steps. First, choose the data set that you would like to visualize, choose the kind of visualization you want, and then customize your visualization before publishing it.
17. Hohli Online Charts Builder
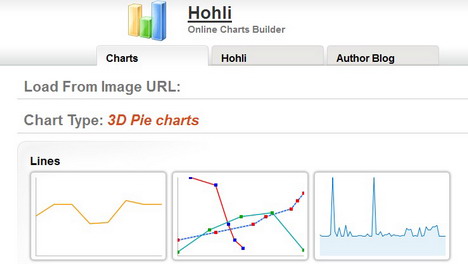
This online charts builder (based on Google Charts API) lets you insert data and build charts for a variety of topics.
18. Venngage
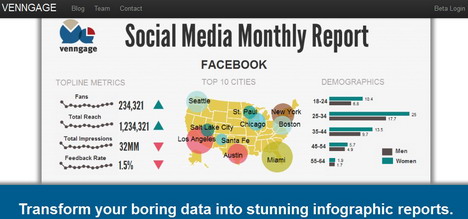
This online tool enables you to create infographic reports for your blogs and websites. It also allows you see how your blog’s audience grows, and analyze data from your social media accounts like Facebook, Twitter and YouTube.
19. StatSilk
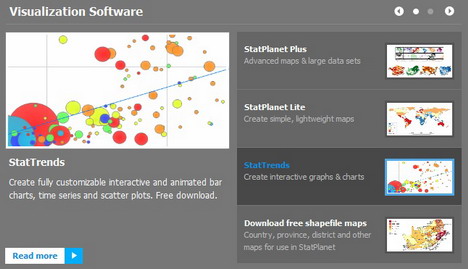
StatSilk is a visualization software that enables you to create a fully customizable, feature rich interactive maps and graphs.
20. iCharts
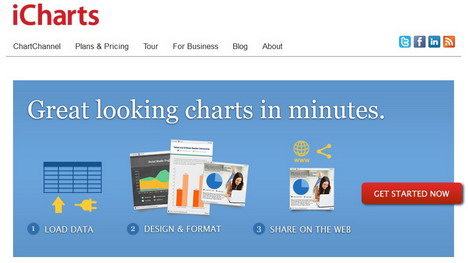
iCharts is a cloud-based charting tool that allows you to visualize, share and distribute data. It makes data storytelling easy with various types of charts, data sets, design templates, and analytics tools.
21. Tableau Public
This is a free data visualization software that enables you create interactive map, charts and graphs easily. It is a completely free tool and the charts you make with it can be easily embedded in any web page. They have a nice gallery which displays visualizations created via Tableau.
22. Gliffy
An online tool lets you easily create quality flowcharts, diagrams, floor plans, technical drawings, and more.
23. InFoto Free
This is photo infographic generator for Android phone. The app lets you create awesome looking high resolution infographics from your photos. All of the infographics can be shared individually or as one large infographic through email, Facebook, Twitter as well as Google+.
24. Tagxedo
Tagxedo turns speeches, news articles, and slogans into a visually appealing word cloud, words individually sized appropriately to highlight the frequencies of occurrence.
25. Wordle
Wordle is another tool for generating “word clouds” from text that you provide. You can tweak the clouds with different fonts, layouts, and color schemes.
26. SIMILE Widgets
This is free and open-source data visualization web widgets.
Tags: chart & graph, infographic, utility software, web app


