Posted on
March 25th, 2025
by Quertime Team in Web Tools
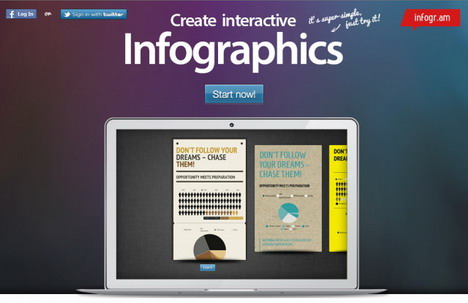
It is important in our world of data to be able to convey complex information in a format that is interesting and visually appealing. Infographics and data visualization tools help turn raw data into readable, enjoyable charts, graphs, and illustrations for consumers of the information. These tools have become essential in business, education, marketing, and research. The ability to produce beautiful reports, social media graphics, interactive dashboards, or visual presentations has never been easier using free infographic tools and data visualization software.
This article discusses the top 35 free software options rated based on the needs of the user from beginner to advanced. Read more…
Updated on
April 22nd, 2025
by Quertime Team in Web Tools
Data visualization, simplifying complex information, and enhancement of the presentation are all facilitated by creating charts, graphs, and diagrams. If your task is one of these – student, business person, or data analyst—the most effective way to present your data will vary. A few very good-looking tools give results without the high price of most software solutions. Many tools support bar charts, pie graphs, flowcharts, mind maps, and network diagrams, fitting different needs across industries. Most are also user-friendly, with templates, which allow you to set some things and share them with other users. These types of tools allow for the rapid creation and sharing of visualizations.
Here are 30 of the top online tools that can make the job of designing charts, graphs, and diagrams a lot simpler. These are tools that can make your report writing, presentation-making, or brainstorming session faster and easier by helping you visualize your data. Read more…
Posted on
September 10th, 2024
by Quertime Writer in Web Tools
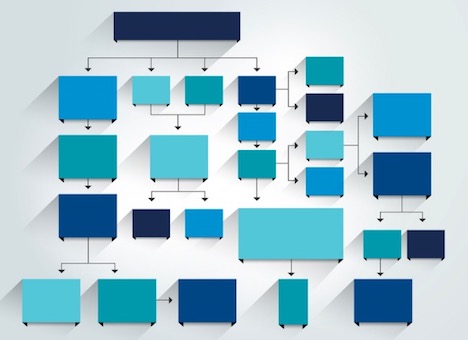
In today’s corporate world, it has become a routine task for project or product manager to create different wireframes, flowcharts, and diagrams etc. to slice off the complex tasks. Such techniques have become an integral part of ideating many work processes like website development lifecycle, understanding the cause and effect of software product failure, project management, etc.
With the advent of technology and internet, many web-based tools and apps showed up with an easier approach to draw, change & reproduce flowcharts, wireframes, diagrams, and organizational chart as per the user convenience. These tools offer a clear depiction of processes via graphical representation while saving on our time. However, these can be extremely misleading sometimes, if not properly organized. And, everything will appear no less than an ordeal. Read more…
Posted on
September 28th, 2018
by Quertime Writer in Freebies
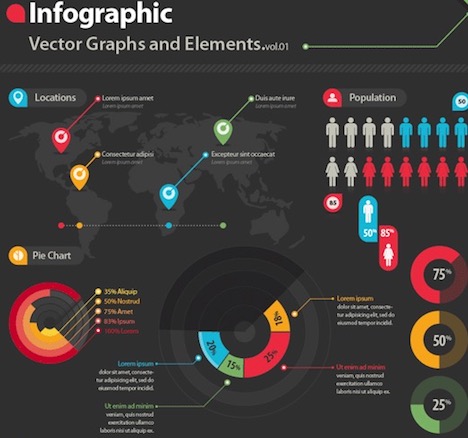
We all know how much of a valuable asset infographics are when we’re working on a presentation. They help us represent large heaps of data in a well-structured and intelligible way. Furthermore, a well-designed infographic will make your presentation much more engaging.
But we’re all well aware of the fact that they aren’t that easy to make. This is why it’s always a good idea to opt for high-quality templates off the Internet. This is why we’ve compiled a great list of infographic kits and templates, so you don’t have to. You can use them whenever you need to structure information but in a quicker and more sophisticated manner. Read more…
Posted on
June 28th, 2017
by Quertime Writer in Web Tools
Today data can be practically seen concentrated in almost every other thing in our daily lives, ranging from the small labels on food items to critical performance reports pertaining to different industries. As a consequence, it is becoming increasingly complicated for designers worldwide to display data is a way that stands distinctly from the rest of the data streams in the competition.
Given the increasing trend of employing data visualization to attract attention to key elements in a message, there are a number of free graphic design software that can be found online to help you with the work. In order to realize how creatively you can display different types of data, there are some brilliant data visualization tools that are up to the job of providing amazing results. Read more…