Top 60 Best Social Media Infographics You Must See
Social media is one of the fastest growing areas in the world of Internet. With the rising of social networking sites like Facebook, Twitter and Google+, social media has dramatically changed the way individuals, communities and organizations communicate. More and more companies started to build their social media presence, communicating with customers in an interactive way and encouraging them to be a part of the business.
Since we all know that social media has become part of our daily lives and for that reason we should always update ourselves with recent information on social media. In today’s post, we’ve gathered 60 really awesome infographics related to social media, which contain very interesting information, data and statistics, presented in the fun and beautiful way.
We hope you enjoy this cool and informative collection! Don’t forget to tell us which infographic you find the most insightful.
(Image Source: TheConversationPrism.com)
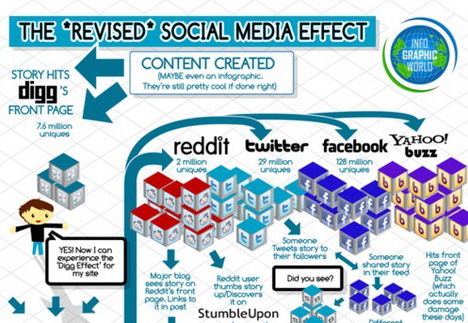
The Revised Social Media Effect
Check out this social media infographic to understand Facebook, Twitter, StumbleUpon, Reddit, and Digg better.
Facebook Facts You Probably Didn’t Know
Check out below infographic if you want to impress anyone with your knowledge of Facebook.

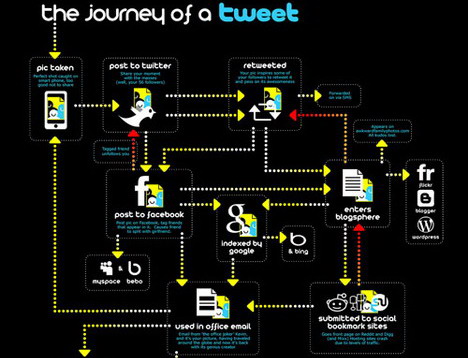
The Journey of Tweet
Find out how a tweet travels around the internet.
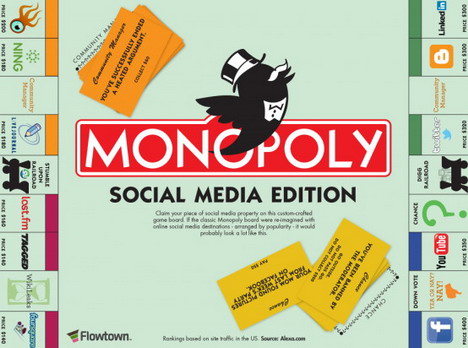
Monopoly: Social Media Edition
This is social media version of Monopoly game.
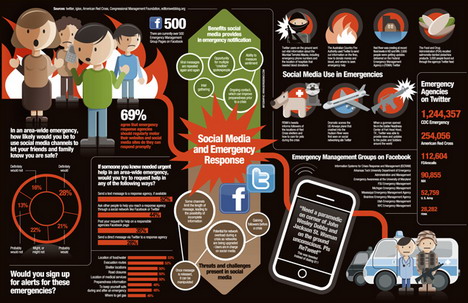
Social Media and Emergency Response
This infographic shows how we use social media during emergencies.
The History of Social Networking
Check out this infographic to understand the history of social media from 1971 to 2008.

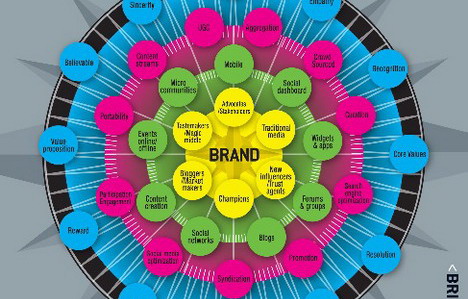
Social Compass
The social marketing compass points a brand in a physical and experiential direction to effectively connect with customers, peers, and influencers, where they interact and seek guidance online.
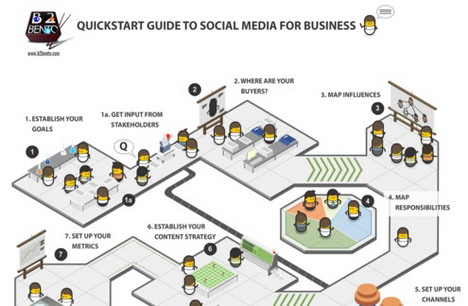
Quickstart Guide to Social Media for Business
Learn how to use social media for businesses.
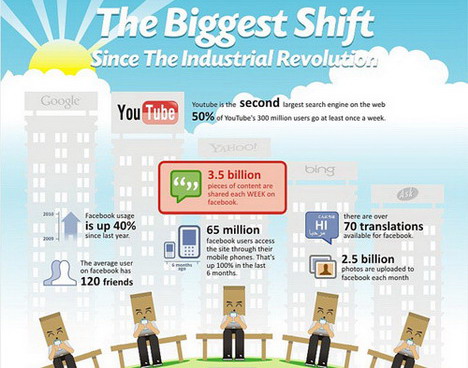
The Biggest Shift
Here’s the infographic on the biggest shift in society since the industrial revolution.
The 2010 Social Networking Map
Geographic area is indicative of estimated number of users per designated social network.

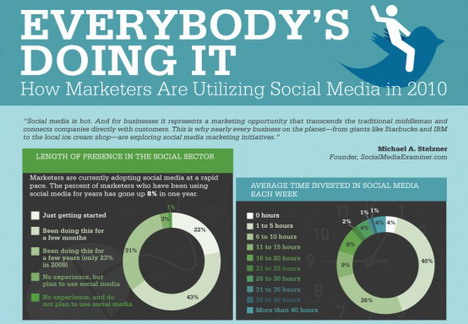
How Marketers are Utilizing Social Media in 2010
This infographic was created using data from the Social Media Marketing Industry Report for 2010, which provides some great insight into the growth of the social realm.
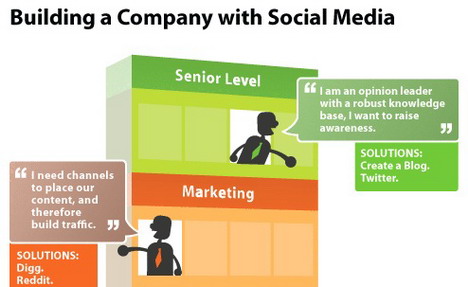
Building a Company with Social Media
This infographic provides some great ways that a business can leverage specific social sites to achieve departmental goals.
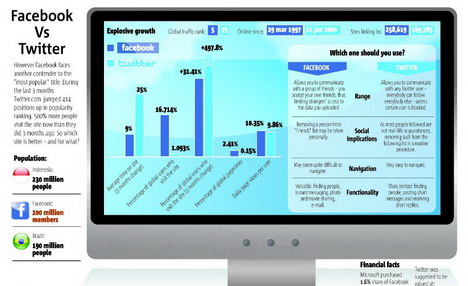
Facebook Vs Twitter
The below infographic shows some interesting statistics about Facebook and Twitter.
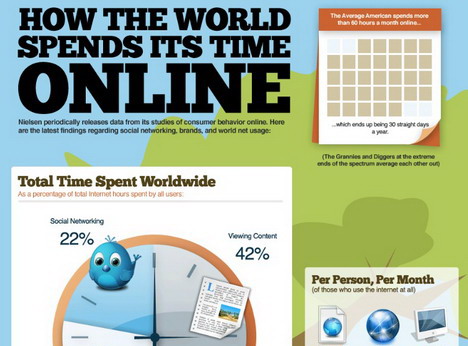
How the World Spends Its Time Online
Nielson periodically releases data from its studies of consumer behaviour online. Here are some findings regarding social networking, brands, and world net usage.
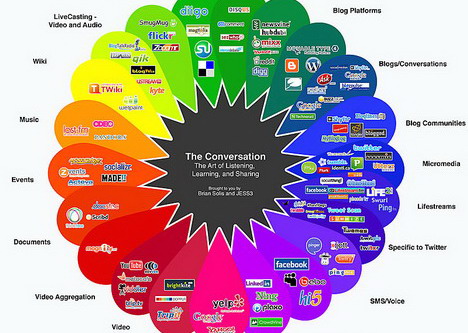
The Conversation
Learn the art of listening, learning and sharing through social media.
The Boom of Social Sites
This infographic details the relative size of social networks from 1995 to 2007.
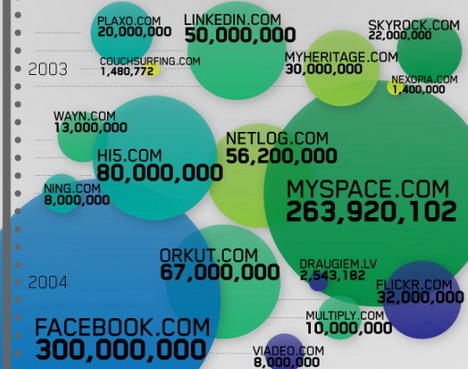
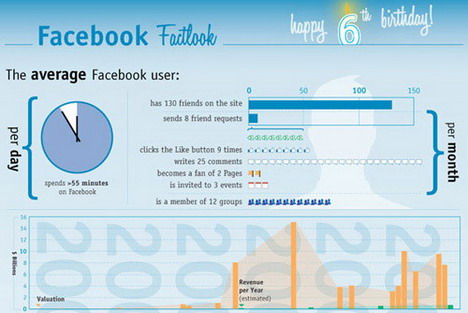
Facebook Factbook
Visualizing 6 Years of Facebook.
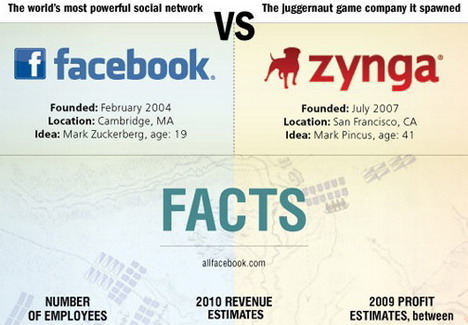
Facebook Vs Zynga
Ever wonder how the most popular online game developer compares to the world’s largest social network?
How the Auto Industry is Embracing Social Media
Check out how the largest car companies are reaching out to the public through social media.

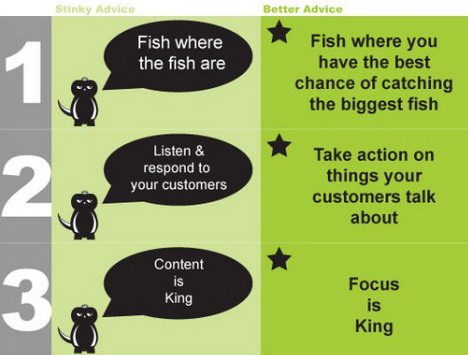
How Should I Use Social Media
Check out this infographic to learn how to use social media effectively.
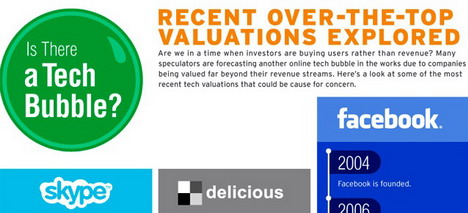
Is There a Tech Bubble?
This infographic evaluates social media companies like Facebook, Delicious, and Twitter finding out which of them may be overvalued or undervalued.
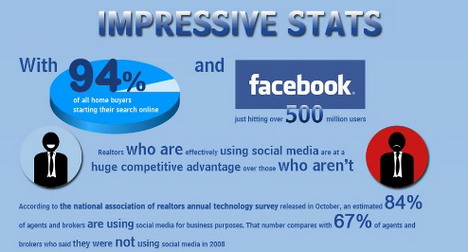
Real Estate Social Media Infographic
This infographic shows realtors who are effectively using social media are at a huge competitive advantage over those who aren’t.
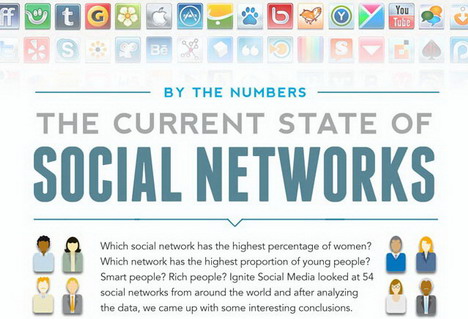
The Current State of Social Networks
This infographic tells you who are the winners and losers of social media.
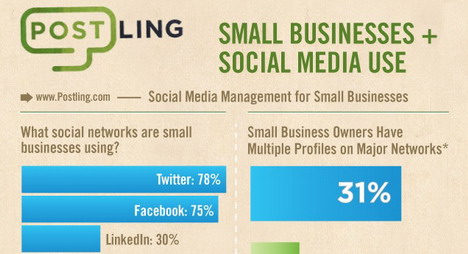
Small Businesses + Social Media Use
Wonder how small businesses are using social networks?
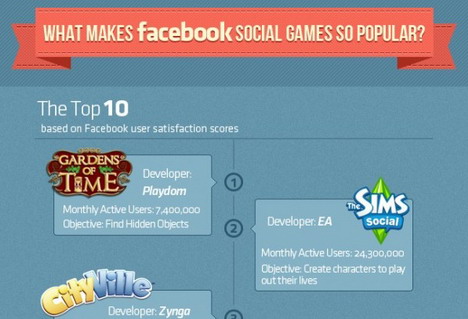
What Makes Facebook Social Games So Popular?
This inforgraphic addresses the sheer volume of Facebook users who play social games, and the results of their game playing.
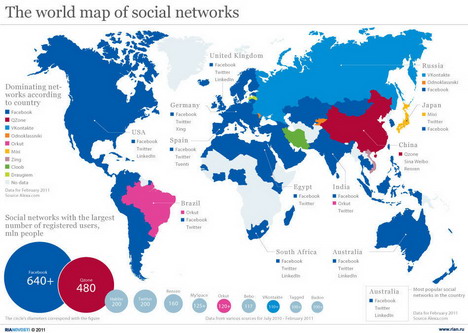
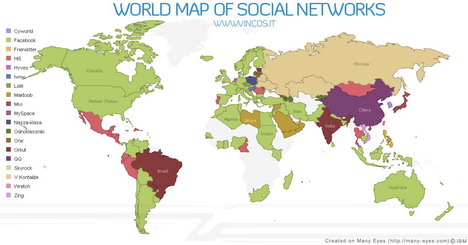
The World Map of Social Networks
In this infographic you can see how social networks grow across the globe.
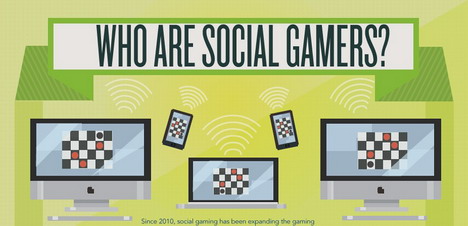
Who are Social Gamers?
We all know that social gaming has been growing rapidly in the gaming industry, but who exactly social gamers are?
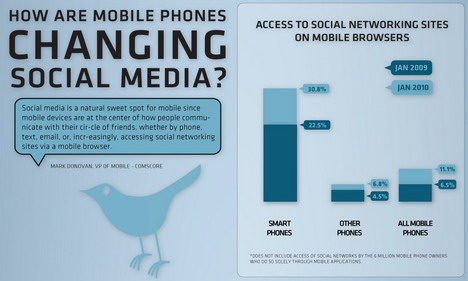
How are Mobile Phones Changing Social Media
This infographic analyzes how mobile phones’ve changed social media.
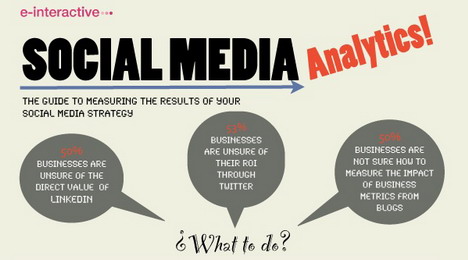
Social Media Analytics
This is a guide to measuring the results of your social media strategy.
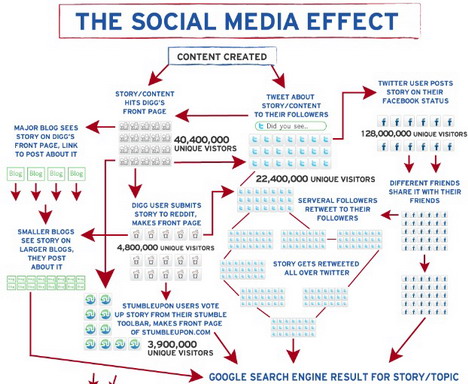
The Social Media Effect
Check out the way content development is used to create all sorts of goodness for your brand inside social networks.
Instant Messaging Facts and Figures
Some facts and figures about IM clients and networks including Live messenger, Skype and Tencent QQ.

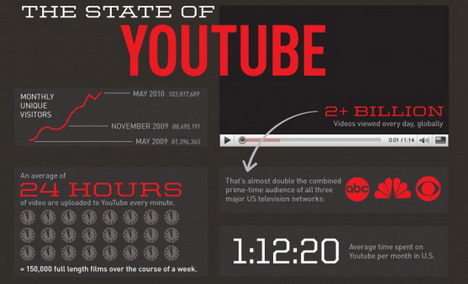
The State of YouTube
The below infographic provides stats on some of the most interesting aspects of YouTube.
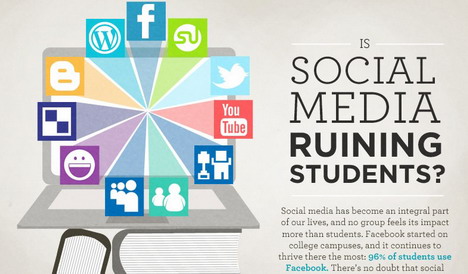
Is Social Media Ruining Students
There is no doubt that social media has had a huge impact on the lives of students. Let’s break down the pros and cons.
The Rise of Social Networking Ad Spending
This infographic breaks down where our social media money are being spent and shows forecasts for social ad revenue.

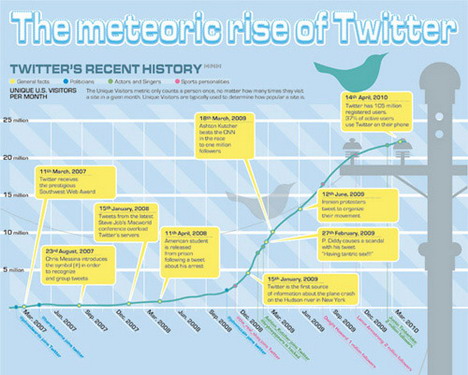
The Meteoric Rise of Twitter
An interesting infographic that shows the history of Twitter, comparison of Twitter and Facebook, breakdown of Twitter users in the US, and other statistics.
Facebook Vs Google
This infographic showcases the differences between Facebook and Google which makes it more fun.
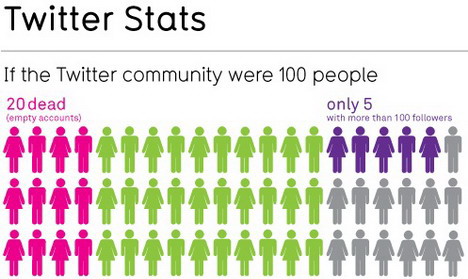
Twitter Stats
Interesting statistics if Twitter community were 100 people.
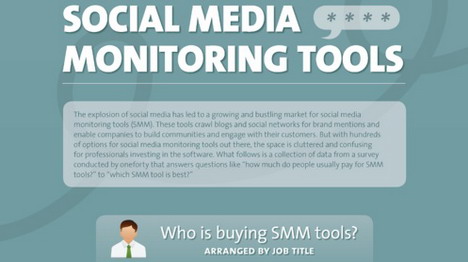
Social Media Monitoring Tools
This infographic provides a collection of data from a survey conducted by oneforty that answers questions like “how much do people usually pay for SMM tools?” to “which SMM tool is best?”
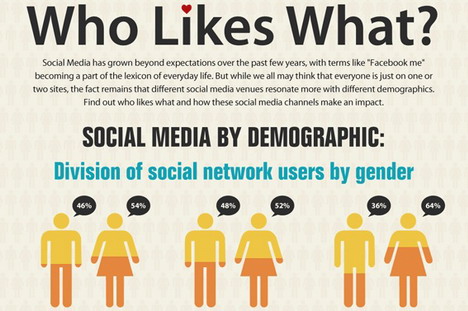
Who Likes What: Social Media By Demographic
This infographic breaks down the top social networking sites by gender, age, income, etc.
The Rise of Social Gaming and Zynga
Check out this cool infographic for interesting statistics about “Social Gaming”.

Top Social Media Brands
Check out international brands and celebrities’ social media presence and their followers.

Do You Need a Social Media Detox?
If you find yourself tweeting from the shower and updating Facebook while driving 90 on the freeway, check out this infographic to save your life.

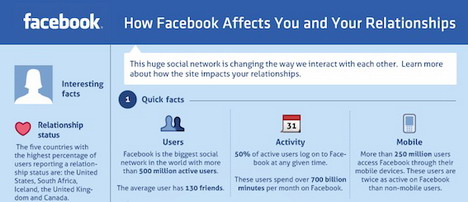
How Facebook Affects You and Your Relationships
This infographic shows the Facebook effect on relationships.
The Modern Media Agency
This infographic tells you what makes the modern media agency.

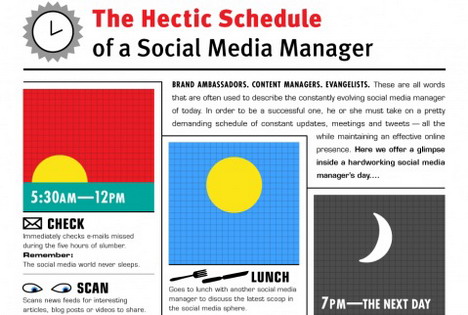
The Hectic Schedule of a Social Media Manager
This infographic gives you a glimpse inside a hardworking social media manager’s day.
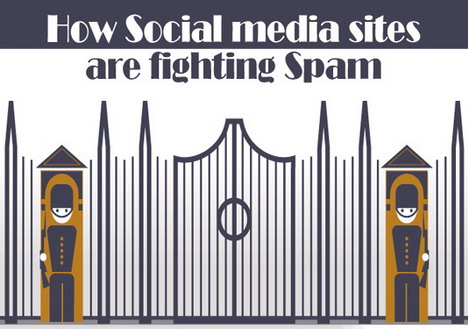
How Social Media Sites are Fighting Spam
Understand how social networking sites fight against spam.
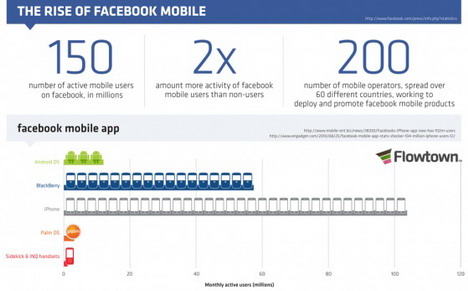
The Rise of Facebook Mobile
Check out below quick statistics on Facebook mobile usage in general.
World Map of Social Networks
This map shows a number of popular social networks’ territories across the globe.
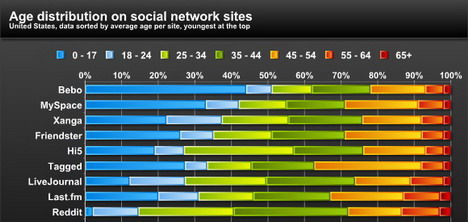
Age Distribution on Social Networking Sites
This graphic shows some useful statistics regarding the age distribution across a number of popular social networking sites.
The World of Facebook
Another great infographic that provides some interesting statistics about Facebook: number of users, activities, popularity in different countries, and more.

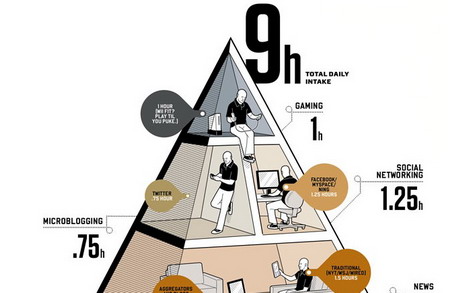
Balance Your Media Diet
Here are Wired’s suggested servings for optimal media health.
YouTube Facts and Figures
Five years of YouTube: A history of memorable moments.

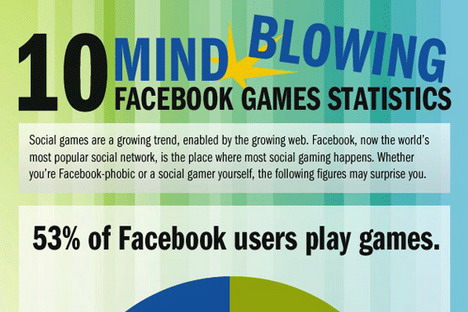
10 Mind Blowing Facebook Games Statistics
Find out some of the most intriguing statistics about Facebook games.
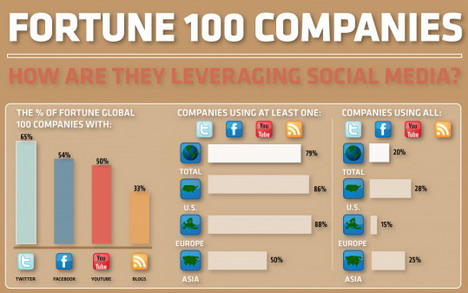
How Companies are Leveraging Social Media
This infographic is created based on the report from Burson-Martseller highlighting the Fortune Global 100 companies and how they were using social networks.
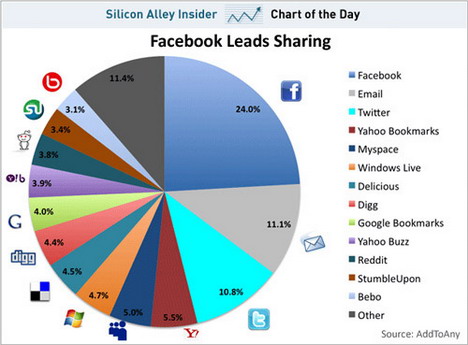
How People Share Content on the Web
Understand how people share content on the web through social networks.
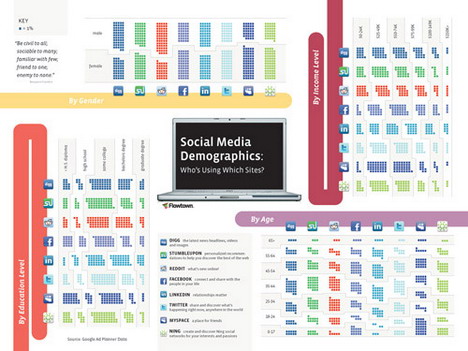
Social Media Demographics
Check out who’s using which sites based on age, gender, income level, and education level.
Profile of Twitter User
This infographic shows different types of twitter users, with a humorous twist.

How are Small to Medium-Sized Businesses Spending?
Check out how small or medium sized companies’ money being spent in social media.

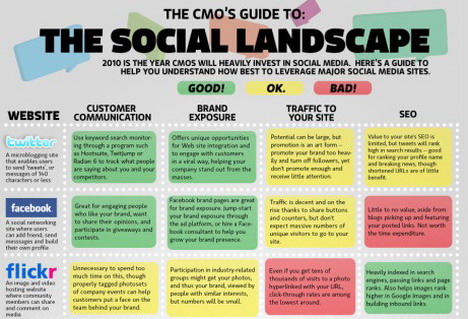
The Social Landscape
Here’s 97th Floor, an SEO and social media firm’s take on 10 social network choices.
Women in Social Media
This graphic tells you how forty-two million women in the US participate in social media.

You May Also Like:
 20 Most Shocking Social Media Facts and Secrets
 40 Best Social Media Search Engines to Find People & Profiles
 Best Times to Get Most Likes, Shares & Tweets on Social Networks
 50 Best Facebook Infographics You Must See
 Promising Social Media Trends for Emerging Users Online
 10 Ways How Hackers Attack Your Social Media Accounts
 Social Media Myths and Truths Every Digital Marketer Should Know
 4 Online Tools to Search Hashtags from Multiple Social Networks
Tags: artwork, facebook, free download, google, infographic, inspirational idea, it knowledge, social media, twitter, youtube
Comments are closed.


![Angry Birds Disrupt the Farm [Infographic]](https://www.quertime.com/wp-content/uploads/2012/11/angry_birds_infographic-150x150.jpg)


